Translate:
What is a Small-Business Advisor?
EN
Translate:
What is a Small-Business Advisor?
EN
Quality Management System vs. Quality Manual
Requirements for a Quality Management System #(Q.M.S.) provides standards to manufacture products that meet customer and regulatory requirements, provide a higher level of customer satisfaction, improve overall efficiency and performance of operations, and promote continuous improvement. A standard that demonstrates consistently providing reliable products and services that meet customer requirements. It increases business opportunities as potential new customers seek out ISO-certified businesses, building initial trust with rapport.
Quality Management System vs. Quality Manual
A Quality Management System (Q.M.S.) is a system that documents all processes, procedures, and responsibilities for achieving quality policies and objectives laid out by top management. A Quality Manual (Q.M.) is a set of documents that defines the Quality Management System of an organization.
Quality ISO 9001 2015 Process Control.
1. Scope
When/why should an organization adopt this standard?
2. Normative references
Use ISO 9000 for terms and definitions.
3. Terms and definitions
Definitions of various terms referred to in the standard.
4. Context of the organization
Determine the purpose and the direction of the organization.
5. Leadership
The commitment of the top management, quality policy, roles, and responsibilities.
6. Planning
Planning to address risks and opportunities and achieve your quality objectives.
7. Support
People, infrastructure, knowledge, communication, and documented information
8. Operation
Finding customer requirements, designing, delivering, and post-delivery support.
9. Performance evaluation
Customer satisfaction, analysis, internal audits, and management review.
10. Improvement
Nonconformity, corrective actions, and continual improvement.
Quality ISO 9001 2015 Process Control
Customer feedback is a critical part of any business to clearly understand their customer(s). Explains why you are requested to complete a survey for feedback everywhere you shop or buy an item(s). Feedback from the customer is one of the primary performance indicators that can be used to judge a quality management system's overall effectiveness.
The survey data can provide beneficial information to top management, so a pivot strategy plan can be structured to achieve new opportunities or keep and gain new customers. It is easier to keep customers than obtain new ones.
Any business needs to demonstrate its ability to consistently provide products and services that meet customer requirements and enhance customer satisfaction through the practical application of continuous improvement. By hearing what your unhappy customer says, you can overcome the issue without it gaining momentum or any damage to your company's brand or image.
Quality ISO 9001 2015 Process Control.
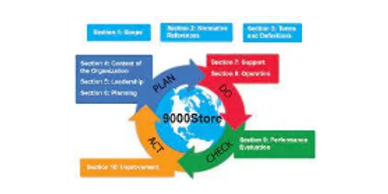
Plan, Do, Check, & Act
As a quality manager, explaining PDCA to new internal auditors is difficult. Plan what you do, do what you do, check what you do, and then act and evaluate.
This process below is a much better way of explaining PDCA. We can continually improve and then make appropriate corrections using the clauses of ISO 9001:2015 below.
Plan, Do Check, Act
We Plan:
Clause 4: Context of the organization
Clause 5: Leadership
Clause 6: Planning
Clause 7: Support
We do:
Clause 8: Operations
We check:
Clause 9: Performance Evaluation (Internal Audits)
We act on:
Clause 10: Improvement (Continuous)
4.1: Understanding the Organization and its Context
The organization shall determine external and internal issues relevant to its purpose and strategic direction, affecting its ability to achieve the intended result(s) of its quality management system.
4.1: Understanding the Organization and its Context
Note 2: Understanding the external context can be facilitated by considering issues arising from the legal, technological, competitive, market, cultural, social, and economic environments, whether international, national, regional, or local.
Quality ISO 9001 2015 Process Control.
Yes! 4.1: Note 2: Screams complete a P.E.S.T.E.L.
Clear instructions, and the process to create a P.E.S.T.E.L. analysis at the URL below.
Systematic, independent, and documented process for obtaining objective evidence and evaluating it to determine the extent to which the audit criteria are fulfilled.
Internal audits, called first-party audits, are conducted by, or on behalf of, the organization itself. Second-party audits are conducted by parties interested in the organization, such as customers, or by other individuals on their behalf. Finally, third-party audits are conducted by independent auditing organizations, such as those providing certification/registration of conformity.
Objective Evidence
Data supporting the existence. Objective evidence can be obtained through observation, measurement, tests, or other means. Objective evidence for the audit generally consists of records, statements of fact, or additional information relevant to the audit criteria and verifiable. Take pictures and make photocopies of evidence.
Quality ISO 9001 2015 Process Control.
The Lead Auditor manages a team of Internal Auditors to focus on the company audit, accommodating applicable standards. The Lead Auditor selects internal auditors and provides them with training, procedures, work instructions, quality forms/testing checklists, and departmental internal audit preparation staff questions.
Lead Auditor Essential Duties
Manage a team of internal quality auditors, evaluate production processes for compliance with the Q.M.S. and Q.M. requirements, inspect calibration tools and records, assist in the audit plans/schedules, identify broken strategies and nonconformance, and search for opportunities for improvement.
Audit Report
The planning phase includes a time frame for the audit, defined roles, documentation of non-compliance activities, audit results, corrective action, preventive action (#CAPA), and a summary of the audit findings.
FREE: ISO Management System Audit Techniques and Best Practices
Quality ISO 9001 2015 Process Control.
The (7) Basic # Q.C. Tools are below.
The cause-and-effect diagram (also known as the "fishbone diagram" or Ishikawa diagram) Identifies many possible causes for an effect or problem and sorts ideas into functional categories.
The check sheet is a structured, prepared form for collecting and analyzing data, a tool that can be adapted for a wide variety of purposes.
The control chart determines if a manufacturing process is in a state of control.
The Histogram is the most commonly used graph showing frequency distributions or how often each different value in a set of data occurs.
The Pareto chart is a bar graph that shows which factors are more significant.
The Scatter Diagram graphs pairs numerical data, one variable on each axis, to look for a relationship.
Stratification (alternatively, flow chart or run chart) is a technique that separates data gathered from various sources so that patterns can be seen.
As a Quality Manager, you should take the # N.C.M.R. (Non-Conformance Material Report) data and use a Pareto Chart to break down the top ten # N.C.M.R.'s. Whatever the top three to five on the analysis, those should coincide with your risk-based analysis report in the same quarter.
Quality ISO 9001 2015 Process Control.
#Pareto #Analysis is a statistical technique in decision-making used to select a limited number of tasks that produce a significant overall effect. It uses the #Pareto #Principle (also known as the 80/20 rule), the idea that by doing 20% of the work, you can generate 80% of the benefit of doing the entire job..
As a Quality Manager., you can use the Pareto Analysis to show the top 10 (N.C.M.R.'s) Non-Conformance Material Report for continuous improvement. First, create a vertical bar chart with causes (leaking, bad threads, or damage as examples) on the x-axis and count (number of occurrences) on the y-axis.
Next, arrange the bar chart in descending order of cause or importance; first, the item with the highest count is. Then calculate the cumulative count for each reason in descending order. This QC statistical process control technique helps me recognize where continuous improvement can be implemented with a reduced potential variation. Pareto Analysis is one of the (7) Basic QC tools for # S.P.C. Statistical Process Control.
Quality ISO 9001 2015 Process Control.
Typical uses of the #Ishikawa #diagram are product design and quality defect prevention to identify potential factors causing an overall effect. However, each cause or reason for imperfection is a source of variation. Therefore, causes are usually grouped into major categories to identify and classify these sources of dissimilarity.
The defect is shown as the fish's head, facing right, with the causes extending to the left as fish bones. The ribs branch off the backbone for significant reasons, with sub-branches for root causes, as many levels as required. Ishikawa diagrams were popularized in the 1960s by Kaoru Ishikawa, who pioneered quality management processes in the Kawasaki shipyards.
Quality ISO 9001 2015 Process Control.
It is a form (document) used to collect data in real-time at the location where the data is generated. The data it captures can be quantitative or qualitative. When the information is quantitative, the check sheet is sometimes called a tally sheet.
A check sheet's defining characteristic data is recorded by making marks or ("checks"). A typical check sheet is divided into sections, and marks made in the different areas have different significance. Data is read by observing the sheet's location and the number of marks.
Check sheets typically employ a heading that answers the Five W's: (ask why 5-times).
Who filled out the check sheet?
What was collected (what each check represents, an identifying batch or lot number)?
Where the collection took place (facility, room, apparatus)?
When the collection took place (hour, shift, day of the week)?
Why was the data collected?
Quality ISO 9001 2015 Process Control.
The #Histogram is commonly used for the graphical representation of numerical data. Most importantly, it is one of the essential quality improvement tools used in various industrial processes. By plotting a histogram, we can examine the shape and spread of our process data. I want to highlight the terms "shape" and "spread." The shape of a histogram can help us to determine whether the data is normal or not. In contrast, the spread of Histograms can help us assess data variability.
Benefits:
Identification of outliers: Outliers are high or low values apart from other data points.
Visual representation: It gives an overall outlook of a process data that is simple to grasp.
Comparison: We can use a histogram to compare the output of different processes.
Some important considerations:
Sample data should be collected randomly.
The sample size should be more than 20.
How can we use the Histogram in manufacturing process scenarios?
Suppose in a Battery #Manufacturing Industry, a quality control engineer needs to ensure that the process is producing the plates within the target value. The target plate weight value is 20 kg since plate dimension is essential in the battery manufacturing process.
The engineer collects a sample of 75 plates by random sampling and measures their weights of it. From the measured data, a simple histogram is created.
Now, my question is, "Whether this process produces a plate within the target weight value or not?" So, what will be our interpretation?
Here, a more significant number of plates were produced with a plate weight of 14 to 24. But our target value is 20. Moreover, many plates were beyond the target. Therefore, this process is terrible and needs work for improvement.
Quality ISO 9001 2015 Process Control.
Also called: scatter plot, X-Y graph.
The scatter diagram graphs pair numerical data with one variable on each axis to look for a relationship.
This information is used to view variable data and relationships between different variable data. The scatter plot can show a relationship involved with the variables. However, it cannot necessarily prove one relationship is the cause of the other.
Factors that make it difficult to say one specific thing would change data.
1. Whether there is a relationship or not
2. Is there a positive correlation
3. Is there. an exponential relationship
4. Is there a quadratic relationship
5. Is there a sinusoidal relationship
A #scatter #plot identifies and corrects problems that occur. It also tracks changes when the issues are worked through to the end. Thus, offering evidence to change and productivity.
Quality ISO 9001 2015 Process Control.
Quality assurance (Q.A.) prevents mistakes and defects in manufactured products. It avoids problems when delivering products or services to customers, which ISO 9000 defines as "part of quality management focused on providing confidence that quality requirements will be fulfilled."
In manufacturing, quality control is a process that ensures customers receive products that are free from defects and meet their needs. Statistical process control (S.P.C.) monitors and controls quality by tracking production metrics. It helps quality managers identify and solve problems before products leave the facility.
Typically, the applicable test (P.S.I., Bubble Leak, Vacuum, etc.) is performed during the production line's last phase. This is often referred to as a final quality control test, ensuring that the product carries out the required customer specifications. In addition, test or heat certification may be required by your customer.
Quality ISO 9001 2015 Process Control.
An Affinity Diagram is a tool that gathers large amounts of data (ideas, opinions, issues) and organizes them into groupings based on their natural relationships.
Method:
State the issues to be examined in broad terms. Generate and record ideas using #Post-it notes. Stick them on a wall in no particular order. Arrange the notes in related or similar groupings. Choose a phrase that captures each group's intent, and place it at the top as a category title.
#Value Focused Thinking
Quantifies the benefit of implementing a decision alternative. Typically maps anticipated benefits and are used for comparison purposes. The first step in building a value function is to identify the values.
Overall Method We Will Employ
Start with values (not alternatives)
Generate better options based on values
Evaluate alternatives using values
This is the #Value #Focused #Thinking (V.F.T.) Philosophy is a mathematical technique used to implement # V.F.T.
Quality ISO 9001 2015 Process Control.
Calibration is essential because it helps ensure accurate measurements. Precise measurements are foundational to the quality, safety, and innovation of products and services your customers use and rely on daily. Calibration improves the quality assurance of precise measurements required in making our products to the required customer design.
Quality ISO 9001 2015 Process Control.
#Q.A. activity should start at the beginning of the design project. The earlier #Q.A. starts, the more beneficial it is to set the standard for achieving quality. Note I said achieve quality as you can never entirely ensure quality. To be considered almost perfect, you must achieve 3.6 defects per one million widgets manufactured per Six-Sigma. Furthermore, the cost, time, testing, and production efforts are challenging if the Q.A. activities become delayed in the stage-gate design and innovation process. You need a world-class manufacturer to design and develop your products.
Quality Control Questions to ask Your Manufacturer
In manufacturing, proper quality control protocols must be in place to ensure a quality product. However, for designers, engineers, and entrepreneurs looking to take advantage of the benefits of a concept-to-creation manufacturer like Girard Equipment, Inc., a few key questions can help determine which manufacturing facility to entrust your design to.
Can you support me in optimizing my CAD design for manufacturing?
It's essential to make sure you've selected the correct manufacturing process for your design, and it's equally important to have a design optimized for manufacturing. There are ways to design products to reduce the time and money spent manufacturing while achieving the same results. In addition, having an engineering team checking your design will make your life easier and prevent avoidable errors.
Do you test incoming materials?
The quality of raw materials varies; to ensure the materials are not deceitful or non-conforming, ask the manufacturer for test certifications and Q.C. inspectors.
What calibration tools do you use?
For manufacturing techniques like C.N.C. machines, the appropriate tolerances and angles are required. It's also beneficial to find out what calibration tools are being used. There is sophisticated equipment for testing bar and plate stock for manufacturing.
What type of measurement tools do you use on finished parts?
These include calipers, bubble-leak, micrometers, pressure gauges, thread and ring gauges, and surface plates. These are the classic measurement instruments used in manufacturing.
The primary process used to make the steel, brass, and aluminum parts for the Mina V2 was C.N.C. machining. Each part was made using a tool and C.N.C. machine appropriate for the tolerances and angles required. A turning center is the best way to make precisely round and concentric parts like a spring mount. In that case, a stainless-steel rod is held firmly in the jaws of the rotating chuck to prevent any unwanted vibration as it's being turned down to the final size.
With the need for tight tolerances, Star decided to machine the most complex parts on its 5-axis C.N.C. mill. Having such equipment helps to avoid moving the piece from one holding fixture to another on different machines, making it tough to hold tight tolerances.
For instance, a parallel spring mount with multiple faces and rounded edges made it difficult to hold correctly when drilling out the center hole. In the end, Star created a unique fixture to hold this part securely to maintain the correct dimensions.
Once the primary machine work was finished, all-aluminum parts were bead blasted, cleaned, and prepared for aluminum anodizing. Anodizing improves the corrosion resistance of the aluminum, provides a hard, scratch-resistant surface, and enhances the cosmetic appearance.
Not all alloys accept the anodizing treatment equally well, but AL-6061 is a good choice and produces excellent results. After bead blasting and cleaning, the aluminum has a non-reflective, matte finish.
After anodizing, the parts have a uniform, semi-gloss dark blue metallic coating. Anodizing adds a thin layer of material to about 3 to 5 microns onto the surface. This is enough to interfere with close fit tolerances and machine threads, so threaded holes must be cleaned after anodizing, exposing bare metal.
To Limit Product #Defects?
The best time to prevent product #defects is during the sourcing and pricing process. #Quality is built into a product, not added after the fact.
#Tip:
1. Don't negotiate the price too low with suppliers
Auditing a potential supplier's # Q.M.S. helps you anticipate potential quality problems before beginning production.
A quality control checklist is the most critical tool for ensuring your supplier and # Q.C. staff inspecting your product understand your expectations.
Suppliers and #Q.C. professionals usually divide their checklist into four distinct sections:
1.) Product requirements
2.) Packaging requirements
3.) On-site product tests and checks
4.) Defect classification
By following these guidelines, you should define different defects under different categories as you see fit based on your operation.
Total Quality Management
Continuous improvement is a requirement for competitiveness and focuses on process & structure rather than just results. Structure (strategy and design), process (support and stimulate), outcome (carrot & Stick), metaphorically speaking.
Quality ISO 9001 2015 Process Control.
Involvement and Empowerment - Empowering employees' ownership of their jobs'.
Teamwork - Utilizing everyone's knowledge - Shift away from Internal competition.
Scientific Tools - 7 basic tools of quality - Improvement Methodology #(FOCUS).
Commitment – Top Management
Training and EducationEducation are a repetitive cycle.
Customer focus - The survival of any organization is dependent on customers.
F-Find a process to improve
O-Organize an improvement effort.
C-Clarify the current process.
U-Understand process variation
S-Select improvement strategies
P-Plan the change
D-Do implement change
C-Check results
A-Act upon the data to modify the change.
Quality ISO 9001 2015 Process Control.
How Process Performance and Quality fits into your Operations Management Philosophy. Using operations as a competitive weapon with operations strategy & project management.
Managing process strategy with process analysis, process performance, quality, constraint management, process layout, & lean systems. Managing value with supply chain strategy, inventory management, forecasting, sales operations planning, resource planning, & scheduling.
Costs of Poor Process Performance
Defects: Any instance a process fails to satisfy its customer.
Prevention Costs: Associated with preventing defects before they happen.
Appraisal Costs: Incurred when the firm assesses the performance level of its processes.
Internal Failure Costs: Result from defects that are discovered during the production of services or products.
External Failure Costs: Arise when a defect is discovered after the customer receives the service or product.
Quality ISO 9001 2015 Process Control.
Waste is any step or action in a process that is not required to complete a process (called "Non-Value-Adding") successfully. When Waste is removed, only the steps that are required (called "Value-Adding") to deliver a satisfactory product or service to the customer remain in the process.
1. Defects – Products out of spec require resources to correct.
2. Overproduction - Workers just keep producing.
3. Waiting - Occurs whenever work has to stop for some reason.
4. Not-Utilizing Talent or under-utilizing peoples' talents, skills, and knowledge.
5. Transportation - Misaligned process flow.
6. Inventory Excess - Misunderstood customer needs
7. Motion Waste - Any excess movement.
8. Excess Processing - Multiple versions of the same task.
The systematic elimination of these wastes can result in faster processes, lower costs, higher quality, happier workers, and, most importantly, happier customers.
Quality ISO 9001 2015 Process Control.
The Eight Dimensions of Quality
Performance, Reliability, Durability, Serviceability, Aesthetics, Features, Perceived Quality, Conformance to Standards.
Statistical Methods.
Statistical process control #(S.P.C.) is useful in monitoring processes, reducing variability through the elimination of assignable causes, and designed experiments. Discovering the key factors that influence process performance, process optimization, & acceptance sampling.
Effective management of quality requires the execution of three activities: Quality Planning, Quality Assurance & Quality Control with Improvement.
Six Sigma is process improvement with an emphasis on achieving significant business Impact. A process is an organized sequence of activities; any process can be improved, an organized approach with improvement is necessary, and the process focus is essential to Six Sigma.
Quality ISO 9001 2015 Process Control.
1. Create constancy of purpose toward improvement.
2. Recognize we are in a time of change, a new economic age.
3. Cease reliance on mass inspection to improve quality.
4. End awarding business on the basis of price alone.
5. Improve constantly on the system of production and service. 6. Institute training.
7. The aim of supervision is to help people and equipment do a better job.
8. Drive out fear.
9. Break down barriers between departments.
10. Eliminate slogans and targets for the workforce, such as zero defects.
11. Eliminate work standards.
12. Remove barriers that rob workers of the right to pride in the quality of their work.
13. Institute a vigorous program of EducationEducation and self-improvement.
14. Put everyone to work to accomplish the transformation.
Quality ISO 9001 2015 Process Control.
A Simple Example
A visit to a fast-food store: Hamburger (bun, meat, mayo, ketchup, cheese, pickle, onion, lettuce, tomato, mustard).
This product has ten components and is 99% good? Add fries and a drink = 12.
Use Six-Sigma to improve the product.
P [Single meal good] = (0.99)¹º = 0.9044
Family of four, once a month: P [All meals good] = (0.9044)⁴ = 0.6690
P [All visits during the year good] = (0.6690)¹² = 0.0080
P [single meal good] = (0.999)¹º = 0.9900, P [Monthly visit good] = (0.99)⁴ = 0.9607
P [ All visits in the year good] = (0.9607)¹² = 0.6186
A process is an organized sequence of activities that produces an output that adds value to the organization's customers. All work is performed in (interconnected) processes, and any process can be improved; an organized approach to improvement is necessary, and the process focus is essential to Six Sigma.
Quality ISO 9001 2015 Process Control.
#Quality #planning is a designed process that meets the established goals under operating conditions. Quality planning is a methodology that can be used when a situation exhibits one or more of the following characteristics: A service has never existed before. Customer requirements are not known.
What is quality planning in total quality management?
A quality plan document(s) that together specify quality standards, practices, resources, specifications, and the sequence of activities relevant to a particular product, service, or project. Quality plans should define a method for measuring the achievement of the quality objectives.
Why is Quality Planning important?
A project manager defines a standard the project will be required to meet to be successful and how those standards will be achieved and confirmed. Without strong quality planning, a project carries an increased risk the customer won't be satisfied with your results.
Quality ISO 9001 2015 Process Control.
Key Performance Indicator (KPI) KPIs evaluate the success of an organization or of a particular activity such as production or products. A KPI dashboard brings all your KPIs together in one place for easy comparisons and analysis side-by-side.
Top (6) KPIs for Manufacturers: Scrap, Throughput, Reject Ratio, Overall Equipment Effectiveness (O.E.E.), Cycle Time, & Production Uptime.
What is a good R.O.I. on a product?
A good marketing R.O.I. is 5:1.
A ratio over 5:1 is considered strong for most businesses, and a 10:1 ratio is exceptional. Your target ratio is largely dependent on your cost structure and will vary depending on your industry. The metrics you measure and track depend on your goals and objectives. Ask yourself what you want to achieve and consider how you can measure the progress towards your goals.
Quality ISO 9001 2015 Process Control.
You accept our use of cookies. This site retains records of consent given by end-users and provides them with clear instructions for revocation of consent. Pages don't host scripts that require user consent, including ad tags & don't contain funding choices consent message tags. Google AdSense matches ads to our site based on our content and visitors. The ads are created, and paid for by advertisers who want to promote their products Google AdSense tracks visitors through clickthrough’s on the ads.